

Part 1 of this blog series recounted the beginning of our wider explorations into churn at Streamtime. User and Revenue Churn, which are essentially the rates at which either are being lost on a monthly basis, are key metrics for SaaS companies for obvious reasons. To spell it out for you, SaaS companies depend on high retention rates for long-term success.
Part 1 tells the story of how we were able to identify trends throughout a customer’s journey in Streamtime which were indicative of their likelihood to churn. Part 2 will explain our next moves — working towards a solution that would not only help us scale this analysis, but that might also allow us to detect that a customer is about to churn before the fact.
Scaling Analysis
Having successfully established our understanding of our churn, we met our next challenge: turning this time-consuming analysis into a scalable process which could be applied to all Streamtime customers.
Certainly not something that could be easily done, and warranted deep-thinking due to a number of complexities.
Complexities, explained:
- Streamtime is a relatively versatile tool that suits a breadth of business models, meaning that our solution would need to fit candidates of all shapes and sizes. In short, there is no universal single measure of usage that could be trusted to accurately identify trends if it were to be applied to all Streamtime customers. Our solution would require each customer to be measured by their own unique journey in Streamtime. One size must fit all.
Believe it or not, creatives aren’t the only ones who use Streamtime. Funnily enough, we’ve seen a number of law firms sign up to Streamtime. As a field that fundamentally sells work by the hour, it makes sense that they’d want a great tool to help them track their time. And, at the end of the day, we won’t get angry at lawyers for using Streamtime if it helps them run their business better.
- Within a company itself, there often lies great variation in the type of Streamtime user. For example, the Account Manager plays a different role to the Creative, and therefore their use of the product is likely to differ (substantially, in most cases). Whilst this fact in itself did not lead to much indecision around our need to track Company data as opposed to the data of each individual User, it did cast some shadows of concern.Our main concern was related to how identifiable a ‘Decision Maker’ (who ultimately calls the shots on Streamtime) might be. In Streamtime, there is a unique ‘Subscriber’, who is normally the person who signed up in the first instance, and drove the implementation of Streamtime in their business. Not always is this the person calling the shots, who must be convinced of Streamtime’s value.Only the Decision Maker holds the true key when it comes down to the problems that Streamtime can solve for a business, and understanding and delivering on these problems is crucial. Part 1 of this blog series provided the perfect example of why this is so important.
- Streamtime’s relative youth as a product, and our nature as a small team, mean that we are continually developing and improving our processes and techniques when it comes to responding to customer needs. We are open to trying new technologies that might assist us in our work and help evolve our processes, so where would this solution sit amongst our current processes?As our primary tool for client communications, it made sense that Intercom would need to be involved. However, our recent investigation into a Customer Success tool saw us explore Salesmachine, whose measures of ‘Good’, ‘Average’ and ‘Bad’ health would lead our thinking of what the end-point of our solution might look like.
- Being able to determine the health of a customer is great, but to monitor this constantly and respond to all cases of ill-health wouldn’t scale well because it demands substantial human effort. Also, by the time that a trend has had the opportunity to develop so that the human eye can easily identify a subtle but critical change in behaviour on a graph, it’s probably going to be too late to save this customer.Ideally, we would be alerted when a customer strays away from their typical usage before they even consider cancelling their subscription. But, how?
Setting the Score
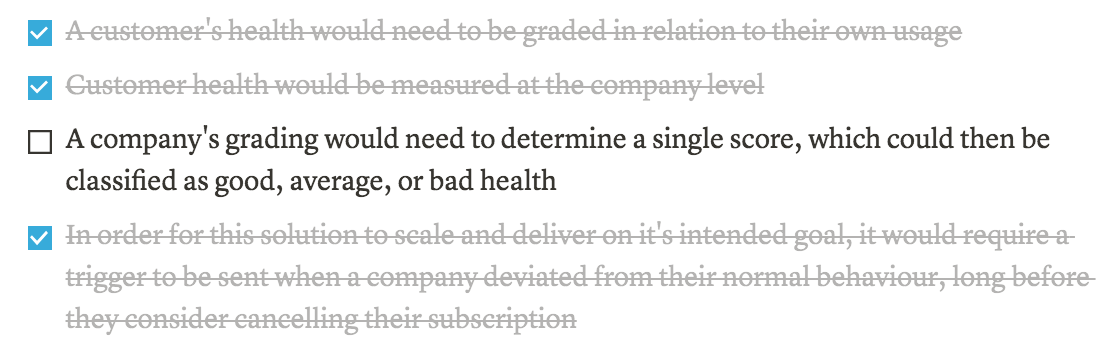
Upon negotiating the above facts, a few things were clear:
- A customer’s health would need to be graded in relation to their own usage
- Customer health would be measured at the company level
- A company’s grading would need to determine a single score, which could then be classified as good, average, or bad health
- In order for this solution to scale and deliver on it’s intended goal, it would require a trigger to be sent when a company deviated from their normal behaviour, long before they consider cancelling their subscription
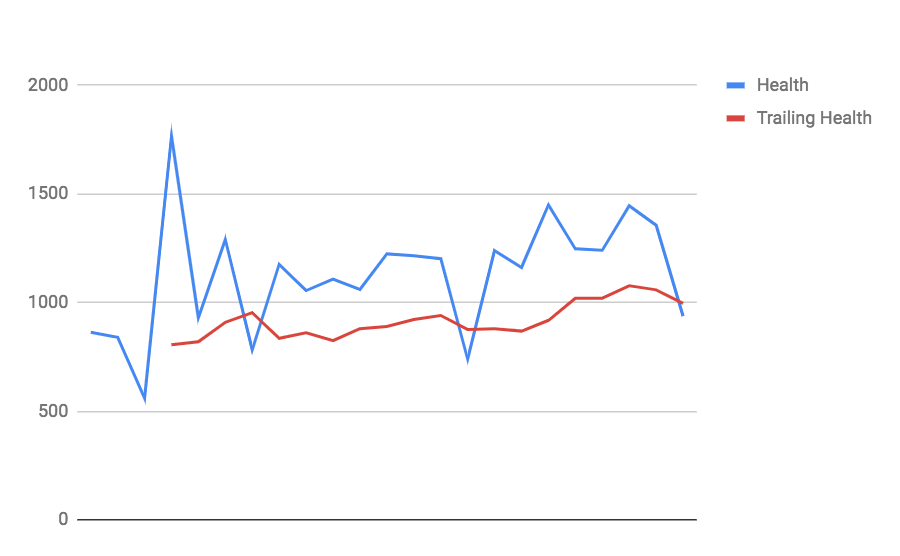
The immediate question our team responded to was that of predicting the cancellation. So, our development team went away and worked some magic. Here’s a graph they came back with.
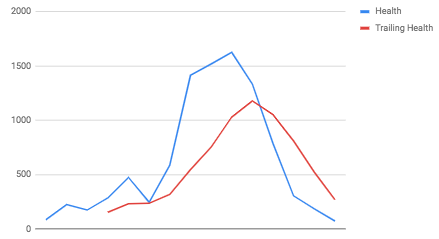
Blue
The blue line in this graph is the company’s health score for that month. In this case, a health score was determined by awarding the following:
- 5 points per job created
- 5 points per quote created
- 5 points per invoice created
As you can see, this company’s health dropped dramatically, but gradually, in the months leading up to their cancellation where the graph ends.
Red
The red line in this graph is the company’s trailing health. Trailing health takes the company’s score from the previous month and applies a 20% tolerance, whilst being mapped over the company’s current health.
The point at which the lines cross is the crucial moment.
Showing us this graph, our developer Alan explained: had the crossing of these lines triggered an alarm, we would have known that this company was likely to cancel two months before they did. It didn’t take long for us to decipher what this meant.
What This Meant
This meant that we had worked out a way of turning the monitoring of and responding to customer’s health, based on their own usage of Streamtime, into an automated process. All of a sudden, our challenges looked like this:
We then asked the question: Well, this looked like it worked for this one company, but what about other companies?
Alan proceeded to show us versions of this graph for all of our churned customer case studies that we had conducted, all of which provided a similar outcome — the first crossing of the lines occurring long before their cancellation dates.
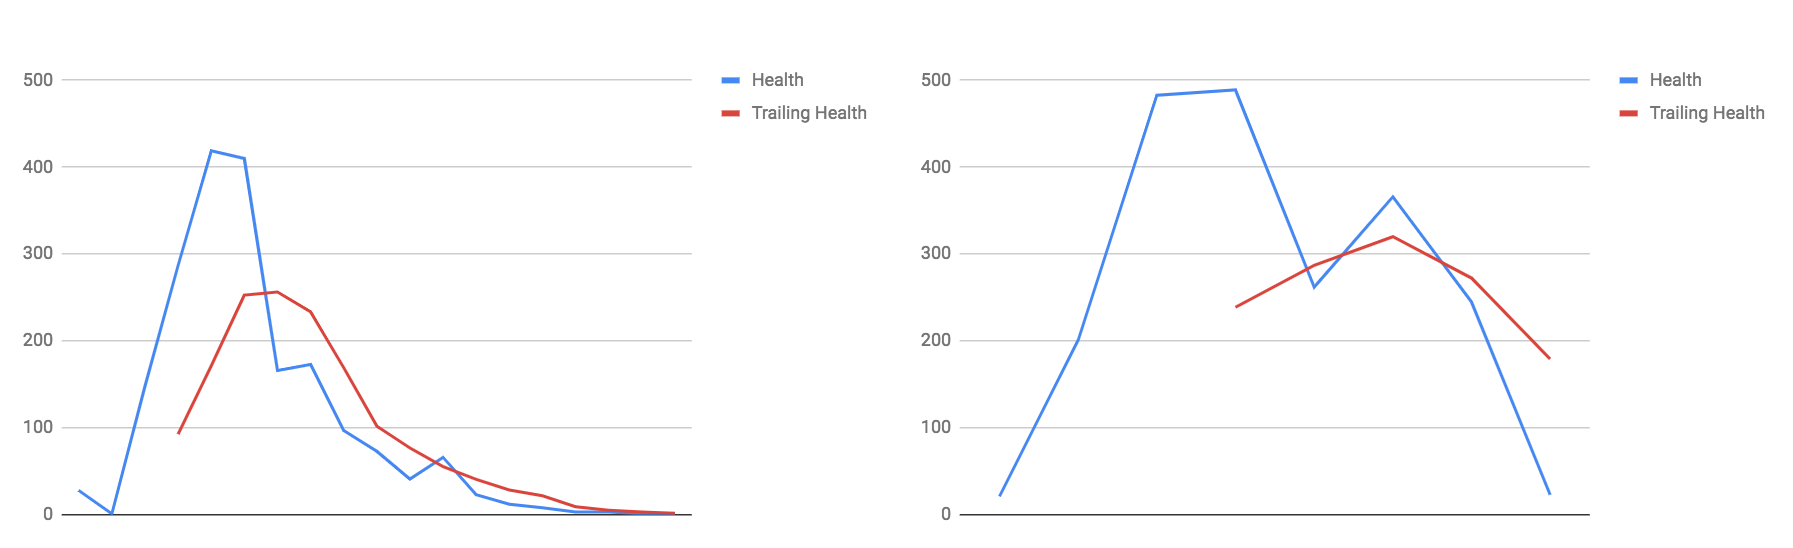
“Lovely,” we said. “Can we take a look at this for existing users?”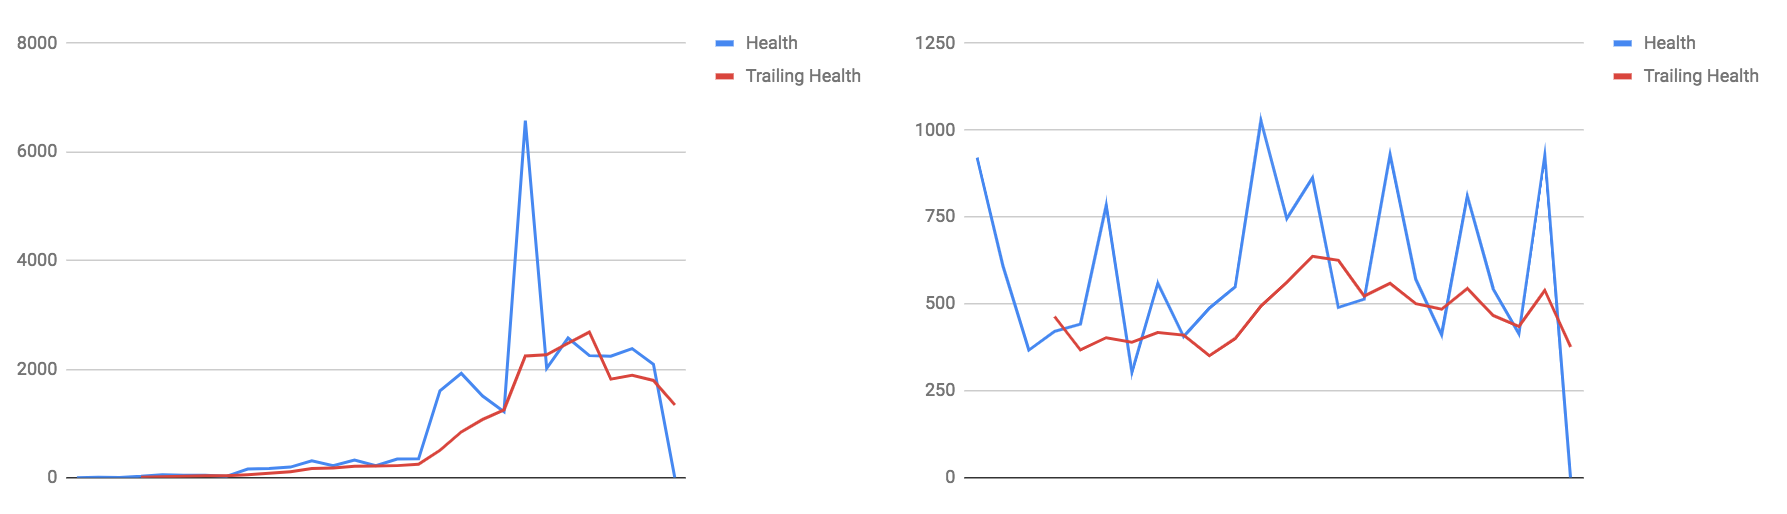
What we see for these two customers is more or less what we expected — consistent trends and the odd spike. The graphs show largely increased usage, with the odd quiet month, and we agreed that we would be likely to see cases like this.
Alan then proceeded to unveil one last company. Here is the graph he showed us…
Our reactions looked a bit like this…
… this, …

… a little bit like this, …

… but mainly this.
This would be our first case of knowing that a current customer might be in trouble and about to churn, with us in a position to prevent this from happening. At the time of writing this piece, they haven’t.
Instantly, the potential value of the work we had done was very clear, and we began thinking about how this could be implemented into our workflow.
In order to deal with spikes in behaviour, we could amend the tolerance to be greater than 20%, which would increase our buffer before we’re sent a warning. We could also use a simple scoring system to identify varying degrees of severity in digression from a company’s trend.
In order to make this whole thing work, we would need to build the graphs and reports into Paula — our database and source of truth when it comes to Streamtime accounts. The idea is, that if Paula were to generate a score (which would quantify the variance of a company’s behaviour on a weekly basis), we could bring this score into Intercom, allowing us to setup automatic messaging or add companies to a segment based on their health.
Our scoring system might look something like this…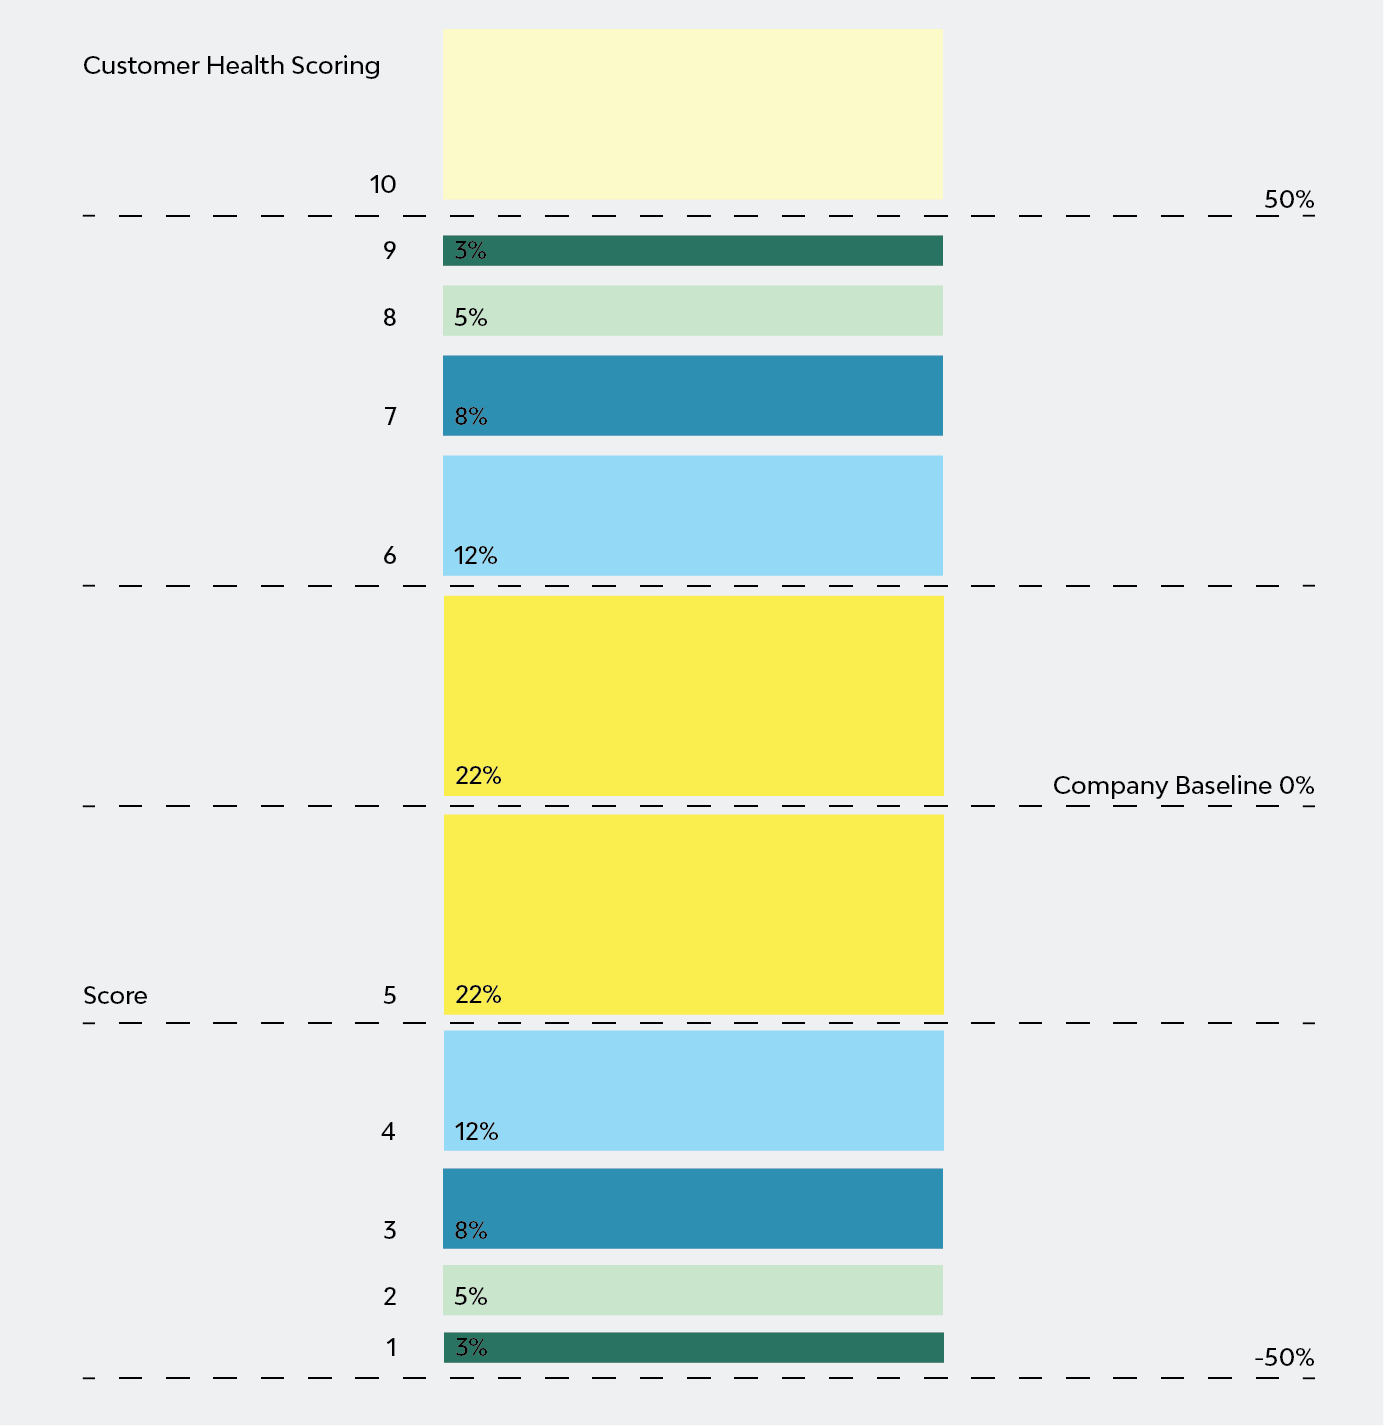
… whereby 5 is considered an ‘average’ score, and scores below 5 are incrementally ‘bad’.
This number could also be pushed forward to a tool, like Salesmachine, which would delegate tasks to our team to reach out to companies in poor health, and help us visualise revenue by company health (as defined by us).
Next Steps
So far we had developed a sound strategy, but it wasn’t quite ready to put into practice. Numbers are a central component of this strategy, which is great, but we understand that not all problems can be dealt with in such a calculated manner.
Understanding the business needs of our customers, and ensuring that Streamtime is delivering on these needs will ultimately be the key factor in a customer’s success. Therefore, this needs to be a measurable attribute — data that we collect from the decision maker upon signing up, which we can then measure their progress on 6 months or so into their journey.